Resource monitoring
When you have several models in production (or even in training), you may want to have information about the health of your environment's infrastructure. This helps to ensure that the size of the environment corresponds to the computation/storage requirements and also to identify any problems.
The Monitoring > Resource metrics page allows you to see any over-use of resources (with the cards at the top), as well as their evolution over time (with the graphs), once an environment has been selected.
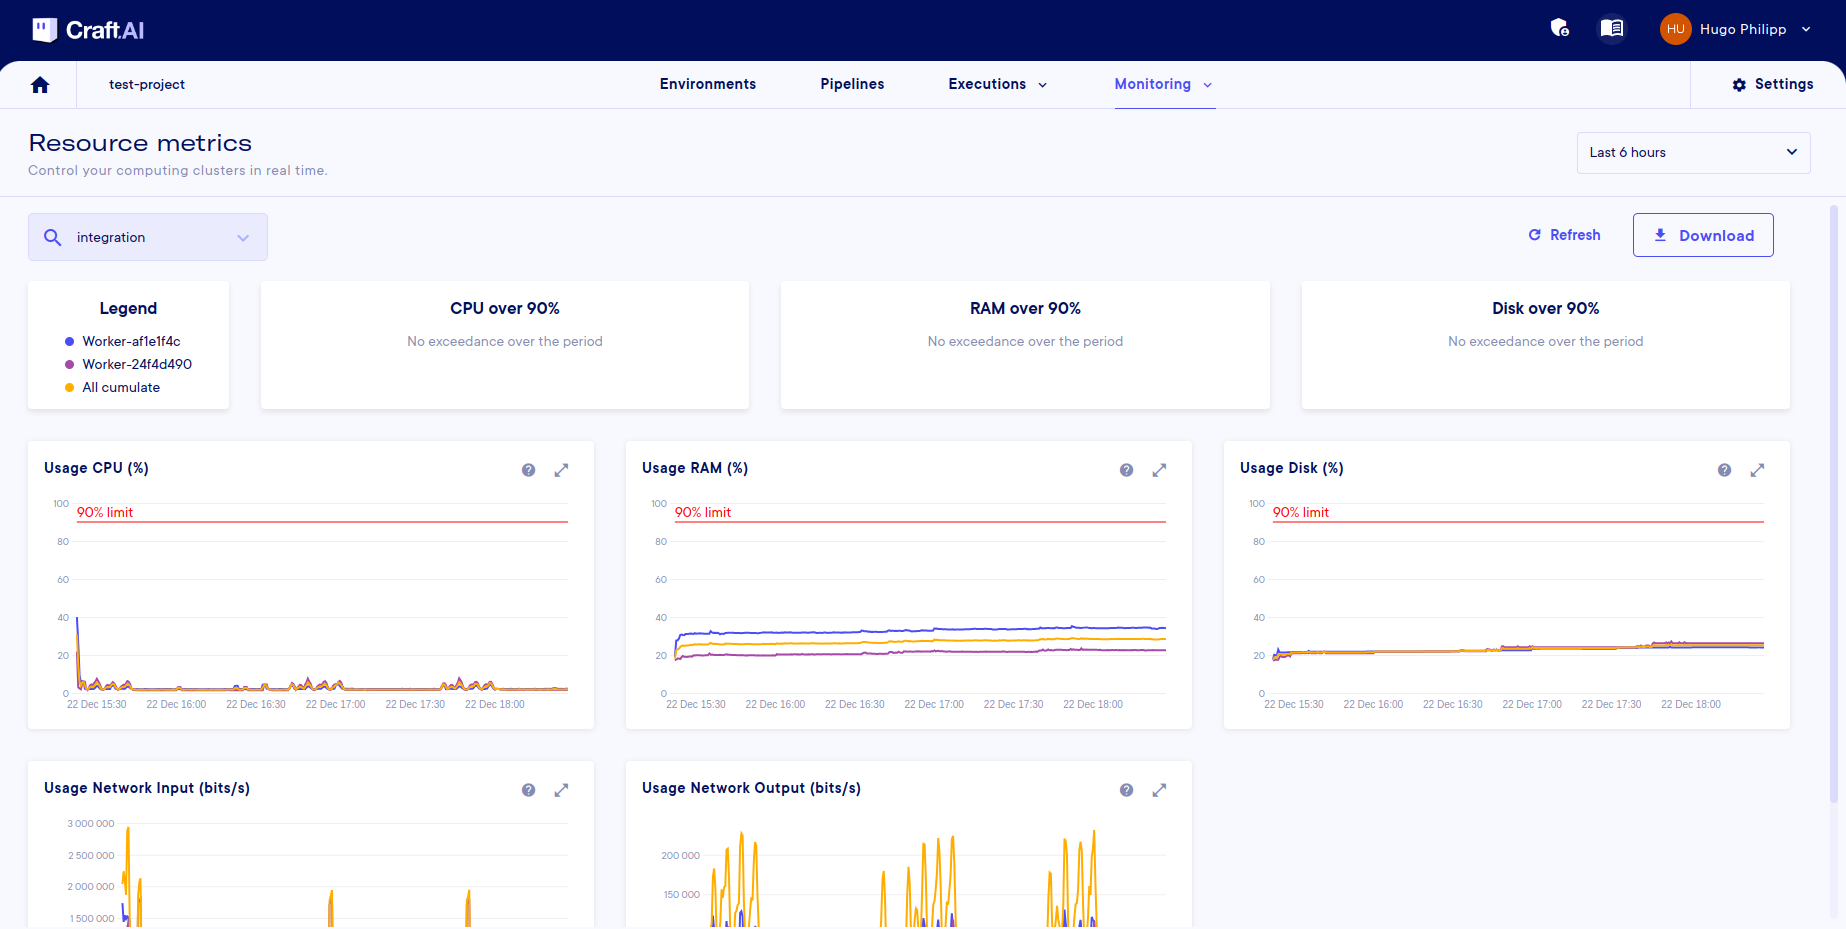
As a reminder, an environment is made up of workers, which are the calculation units within the environment. Each worker, therefore, has a dedicated curve (selectable from the legend) plus a curve for all the cumulative workers.
You can download this data in .csv format using the download button. The data downloaded will be that selected by date and worker (as for the graphs).
Info
It is also possible to retrieve data with the SDK using the sdk.get_resource_metrics(start_date, end_date, csv) function. The csv (boolean) parameter can be used to retrieve data. It will return a csv file as bytes.